 EFE/EPA/SHIRAAZ MOHAMED
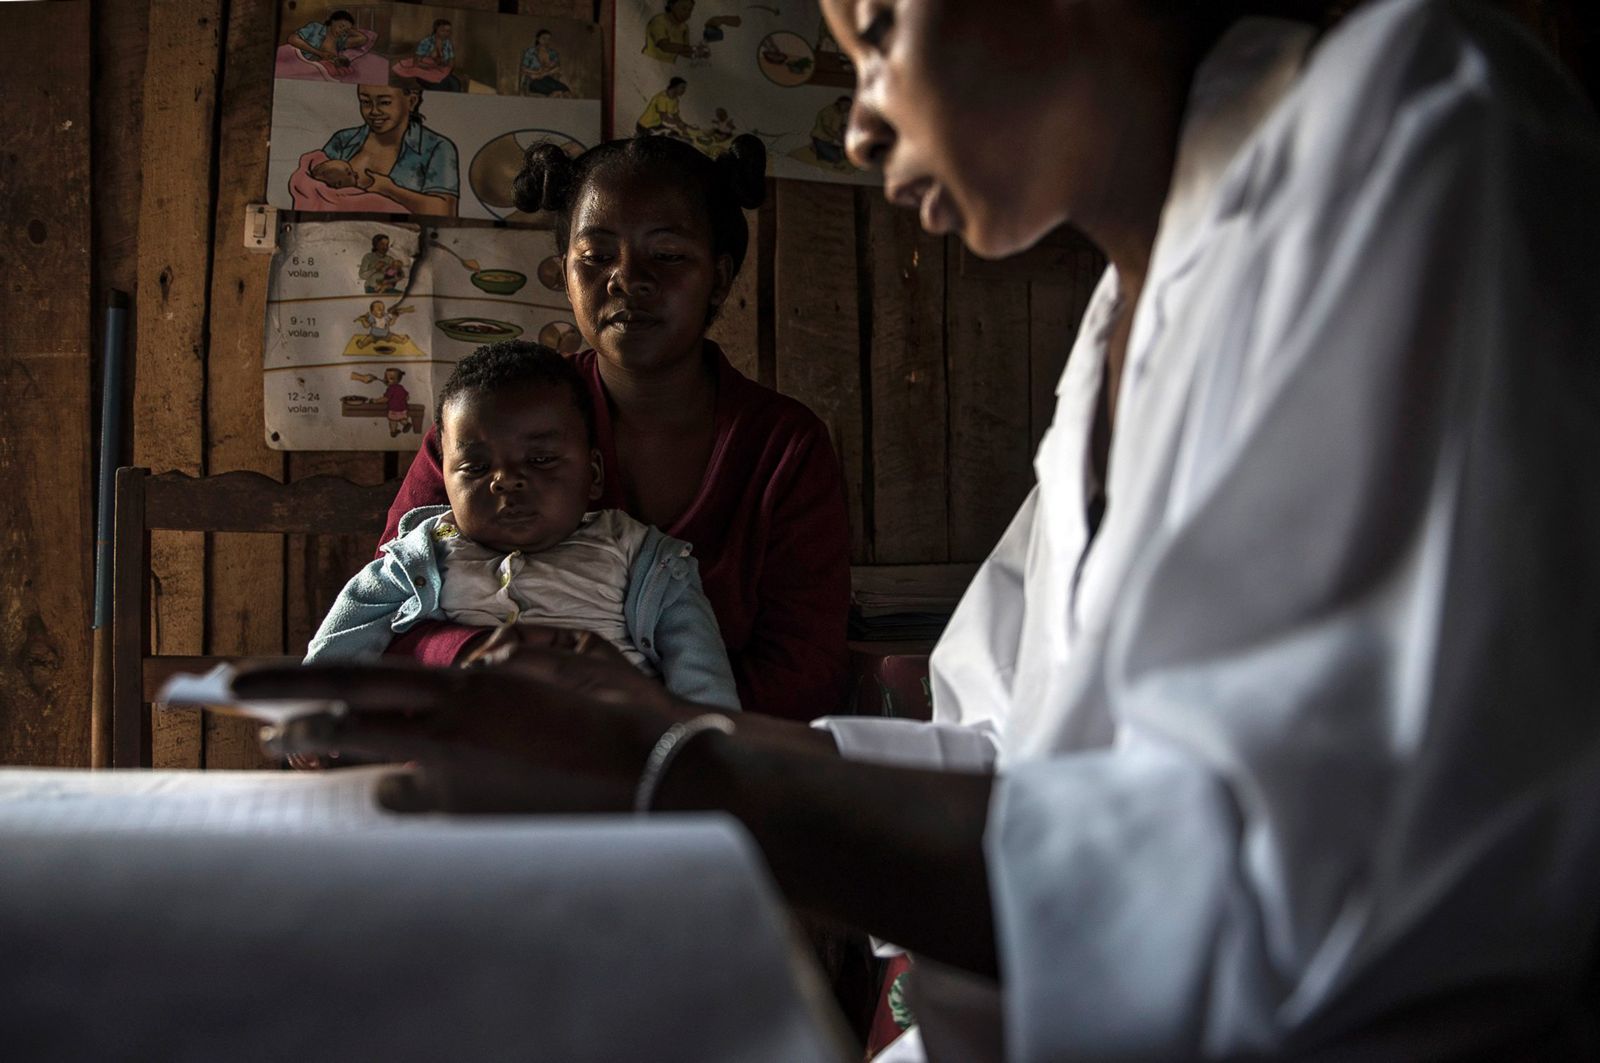
In 2015 a severe food and nutrition crisis affected southern Madagascar with 200,000 people being damaged, of which 40,000 were children under 5.Madagascar is one of the poorest countries in the world.
In the fight to improve global respect for human rights, activists have often lacked an important tool: useful, accessible, and reliable data. The available global measures have been piecemeal and of varying quality, and it has been hard to get a comprehensive overview of how countries are performing in terms of their human rights obligations. Building off our work discussed previously on OGR, we have created a new tool: the Human Rights Measurement Initiative (HRMI) beta dataset.
To start, we are publishing 12 metrics, covering five economic and social rights and seven civil and political rights:
Economic & Social Rights
Our metrics for economic and social rights use the methodology pioneered by Sakiko Fakuda-Parr, Terra Lawson-Remer, and, our own HRMI co-founder, Susan Randolph, with one of our partner organizations, the Economic and Social Rights Empowerment Initiative (ESREI). For each indicator we produce a percentage score, which tells us the percentage level of enjoyment achieved on that right relative to what should be feasible for a country with that income level.
This method can be somewhat confusing for people new to our data. When testing our data with people over the past few months, we have often heard comments such as: “But that score of 90-something percent on the right to education can’t possibly be right. Our country has relatively few resources, and our education system is nowhere near as strong as those in other countries. What’s going on?”
Our measures of economic and social rights determine how well a government is doing with regard to meeting its obligations laid out in Article 2 of the International Covenant on Economic. Social, and Cultural Rights (ICESCR), which obligates the state to progressively realize these rights “to the maximum of its available resources”.
For example, if a country has relatively fewer resources than others, the government is not expected to be able to fulfil the right to education to the same extent as governments in richer countries. The 90-something percent score tells us that the country is doing almost as well as the best performing country with a similar GDP per capita. Even if a country has a score of 100% it can still do better by innovating to extend human rights enjoyment further than has been done in the past. But to provide all children with an education standard closer to that in rich countries would likely also require a higher GDP per capita.
For economic and social rights, we have published data for 120 to 160 countries (depending on the right) over the time period of 2005 to 2015. Because these measures rely on official statistics, however, missing data is still a problem in many countries. There is little we can do about this problem in the short term (except ask governments and others to provide more and better data). But we also hope to overcome this problem in the future, possibly by using more data while simultaneously acknowledging the uncertainty added by missing observations. However, in the near term, the best way of improving our economic and social rights indicators is to encourage governments to collect and release more data on outcomes within their borders. Further, the enhanced efforts to collect the data necessary to monitor the Sustainable Development Goals will help to partially resolve this issue.
While missing data is a problem in some cases, there are other cases where the data are available by ethnic group, gender, region of the country, or other distinction. In those cases, we can use our methodology to determine the extent to which the government is meeting its obligations for different population groups. This can produce important findings. For instance, research has found that the fulfilment of economic and social rights for African American and Hispanic people is worse in every state than the worst performance of any state with respect to white people.
At this time, the economic and social metrics available on our beta website are summary measures for the population as a whole, and a high score does not imply that all people in that country enjoy the right equally. However, if organizations can help us access more disaggregated data, we can calculate these metrics for different groups, and we encourage such groups to reach out to us.
Civil & Political Rights
As discussed in our previous post, our measures of states’ civil and political rights performance draw on the expertise of human rights practitioners located around the world. We gather this information using a multilingual survey and combine the results into quantitative metrics using advanced statistical techniques that ensure the gathered responses are comparable.
Late last year we collected data on 13 pilot countries to demonstrate the usefulness of our new approach. Our intention is to extend our coverage of these rights to most countries in the world as soon as we have secured sufficient funding to do so. If the project acquires sufficient funding to expand our global coverage, then civil and political rights data will be available for most countries as soon as next year.
One of the unique attributes of our civil and political rights data is that we measure both the overall respect for these rights by the government, as well as the distribution of that respect. For the overall respect for each right, our metrics range from a low of 0 to a high of around 10, with higher scores representing greater overall respect. Further, each of these scores has an uncertainty band attached, providing an honest assessment of just how certain we are about each country’s placement on the scale.
Beyond these overall measures, we also publish data on which populations our respondents said were at the greatest risk for abuse in each country. For example, the word cloud below shows the groups most at risk of violations of the right to opinion and expression in Kazakhstan in the first half of 2017.
%2010_22_46%20p_%20m.png)
Word clouds like this one are available for every civil and political right on our beta website, and the complete data are available for download. The word clouds help to provide context for understanding the overall scores a country receives. For example, Angola, Brazil and Saudi Arabia have similar overall scores for torture. However, the word clouds tell us that the groups that our survey respondents considered to be most at risk of torture are different in each of these countries. Our respondents were most concerned about torture that occurs on the grounds of race in Brazil, religion in Saudi Arabia, and towards detainees and suspected criminals in Angola. For more context, we have summarized some of the more detailed survey responses here, and all of the data used to produce our visualizations are available for download on our data website.
There is much more than we can show here in the visualizations and data on our website, and we welcome feedback about any aspect of our work so far. We are just getting started, and we thrive on collaboration with the wider human rights community. We encourage readers to leave comments below, or to contact us directly here.